Easy Tech Tuts
How to Create a Dashboard in Confluence Easily 2026
By Impran M N
When announcements and project metrics live scattered across a deep sidebar tree, your team loses operational visibility. This guide shows how to build a high-visibility dashboard homepage in Confluence in 2026.
01Open your homepage canvas
Open your space homepage, click the pencil icon, and open the canvas options drawer.
02Go full width
Move to the top center toolbar and click the full-width arrow toggle.
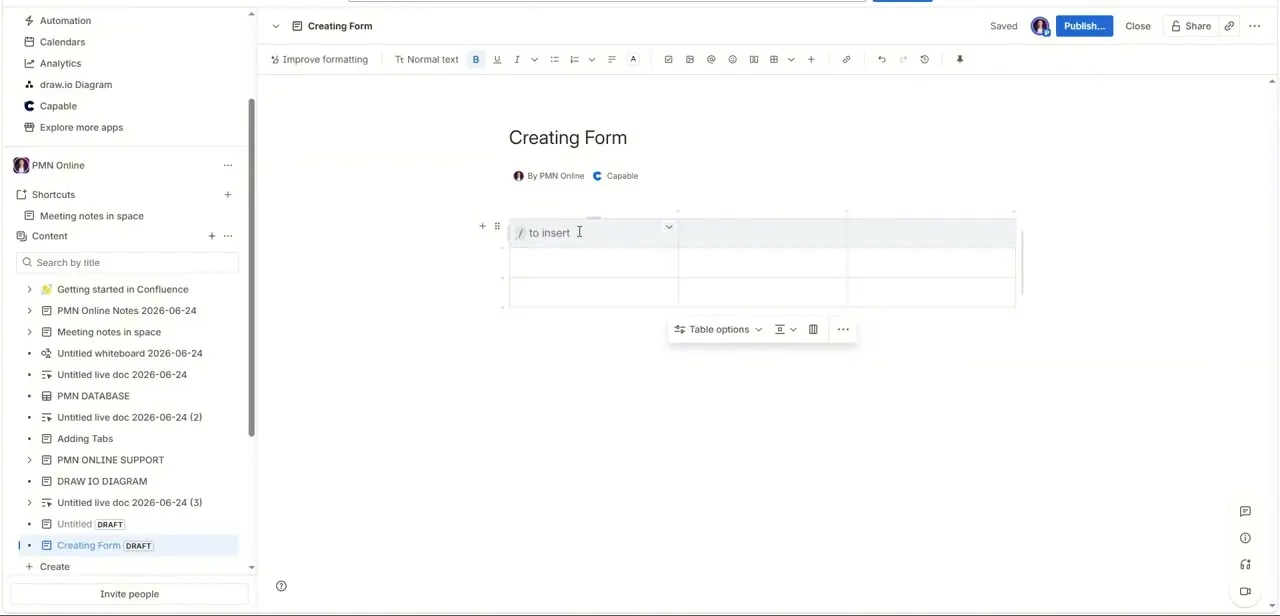
03Add columns
Click the section tool to add layout splitters and organize the page into a multi-column grid.
04Add tracking macros
In one column, type `/activity` or `/jira` to embed live stream updates and sprint trackers.
05Add tasks and calendars
In another column, type `/task` and `/calendar` to deploy checklists and shared release dates.
06Add a roadmap view
Insert a database block or Gantt timeline object to display high-level roadmap metrics.
07Publish
Review your visual hierarchy and click Publish to save the dashboard live.
Frequently asked questions
Will my dashboard update automatically as tasks change?
Yes, the rendering engine coordinates real-time activity feeds so dashboard components update as team members complete tasks.
Can I pull live Jira data into my Confluence dashboard?
Yes, typing `/jira` lets you inject live charts, activity streams, and filtered search results directly into a layout panel.
How do I organize different types of content on a dashboard?
Using the section tool to build a multi-column grid lets you separate task lists, calendars, and Jira feeds into distinct panels.
Will the dashboard look right on both desktop and mobile?
It's worth scaling your layout widths and checking the dashboard across desktop and mobile screens before publishing.
Watch the full walkthrough
The same steps, demonstrated on screen from start to finish.