 Easy Tech Tuts
How to Connect Jira With Power BI - Agile Reporting Setup Easily 2026
By Impran M N
Jira is great at capturing the day-to-day of an agile team, but its native reports only go so far once stakeholders start asking for cross-project or historical views. The fastest way to bridge that gap isn't wiring up the Jira REST API by hand — it's installing one of the dedicated Power BI connector apps from the Atlassian Marketplace and letting it handle the plumbing.
This guide walks through that real setup: starting from your boards, finding a connector, installing it against your site, and then turning the data it pulls into an actual agile dashboard. It's aimed at project managers and analysts who want sprint and velocity reporting without becoming API experts first.
01Know what you're reporting on before you connect anything
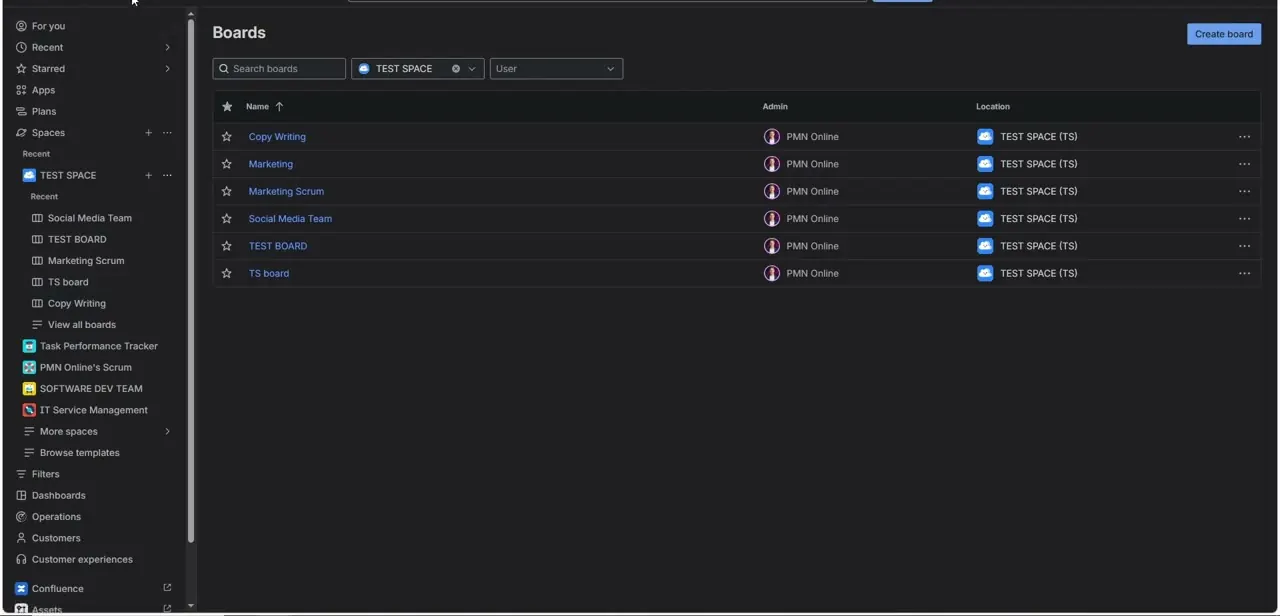
Before touching Power BI, open Jira and look at the boards and spaces you actually work in — Marketing, Scrum boards, a Test Board, whatever your team runs sprints against. The connector you install later will pull from whichever projects and boards you have access to, so it's worth knowing up front which ones matter for the report you're building. If your Jira instance has a lot of legacy or unused boards, this is also the moment to note which ones to exclude, since dragging every historical project into a Power BI report just adds noise.
02Search the Atlassian Marketplace for a Power BI connector
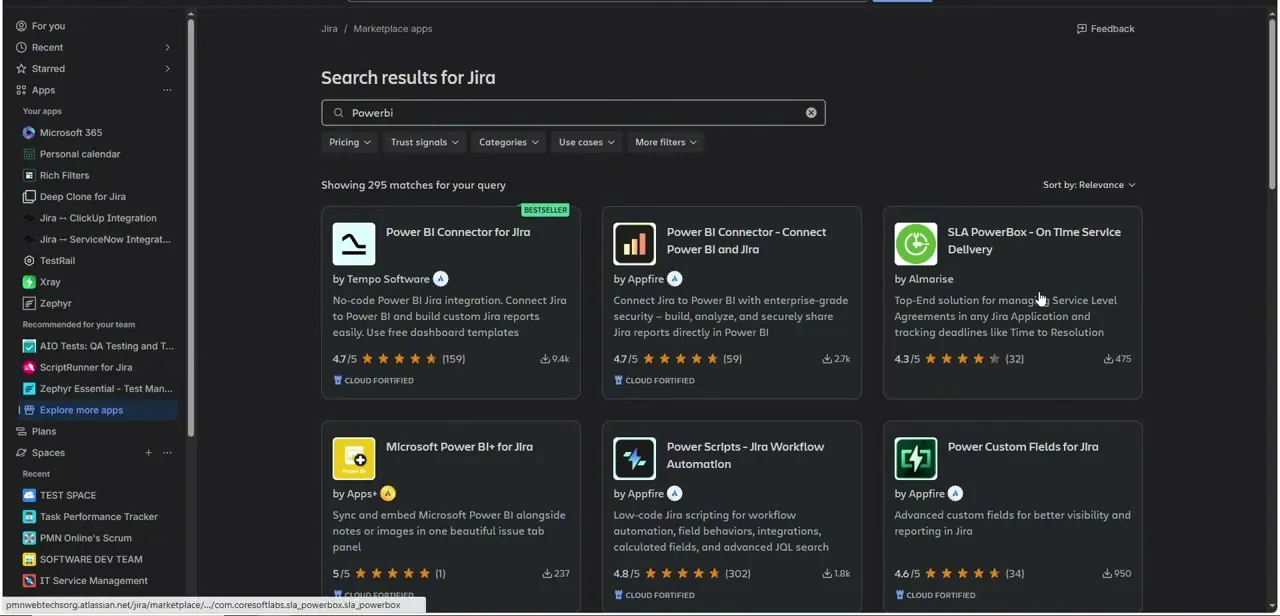
From Jira, go to Apps and open the Marketplace, then search "powerbi." Several dedicated connectors show up — options like Power BI Connector for Jira and similar apps from vendors such as Tempo and Appfire — each promising no-code report building and pre-built dashboard templates. Ratings and install counts are visible right in the results, which is worth checking since these are third-party apps with their own pricing tiers rather than a single official Microsoft integration. Read a couple of the app descriptions before picking one; some focus on embedding Power BI visuals inside Jira issues, while others focus on exporting Jira data out to Power BI Desktop.
03Install the connector against your Jira site
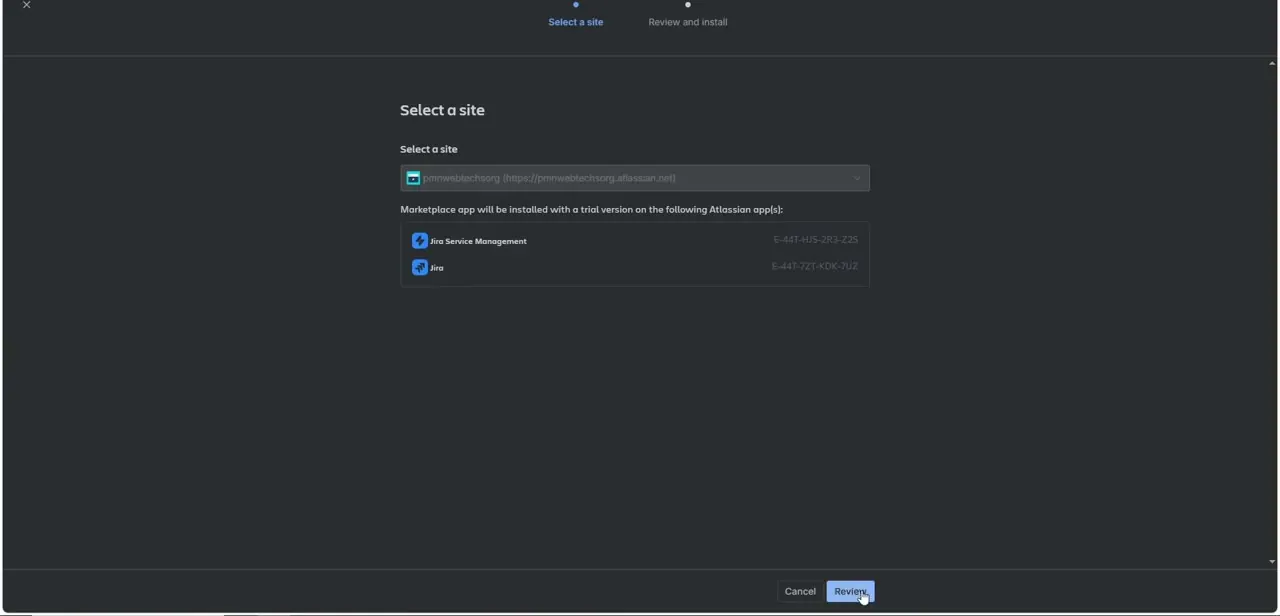
Once you pick a connector, clicking install opens a short flow: select which site to install it on if you manage more than one, confirm the Jira products it will attach to (Jira Software, Jira Service Management, and so on), and review before confirming. Most of these apps start as a free trial, so you can test the connection before committing to a paid tier. This step is also where the app requests its permissions — it needs read access to issues, boards, and sprints to do anything useful in Power BI, so expect a permissions prompt during install.
04Authenticate and pull your Jira data into Power BI
After installation, the connector typically adds a setup page inside Jira or a companion authentication step in Power BI itself, where you sign in with your Microsoft account and grant the app access to your Power BI workspace. From there you choose which projects or boards to sync — this is where the board list you reviewed earlier pays off, since you're picking specific data sources rather than importing everything. Many connectors include pre-built dashboard templates at this stage, letting you get a working report before you've built anything yourself.
05Build the fields into an actual agile report
With data flowing into Power BI, build visuals around the fields that matter for agile tracking: issue status, sprint start and end dates, story points, and assignee. A stacked bar chart of issues by status per sprint gives you an instant burndown-style view, and grouping by assignee surfaces workload imbalances that Jira's own boards don't show as clearly. Because you're now in Power BI rather than Jira, you can also blend in data from outside Jira entirely — budget figures, time-tracking exports, or other project data — something the native Jira reporting screens can't do.
06Apply it to real agile scenarios
Once the basic report works, point it at the questions your team actually asks: is this sprint trending toward completion, which team member's queue keeps growing, and which issue types keep bouncing back to "in progress." A portfolio view that combines multiple boards is one of the biggest wins here, since Jira's native dashboards struggle to show more than one project cleanly at a time. Save these as report pages so stakeholders can flip between a single-sprint view and a program-level view without you rebuilding anything.
07Keep the dashboard current
A Power BI report is only as useful as its last refresh, so set up a scheduled refresh once you're happy with the layout rather than re-pulling data by hand before every meeting. Most of these connector apps support scheduled sync on a paid tier, pulling fresh issue and sprint data on an interval you set. If you're still on a trial, at least get in the habit of refreshing manually before any report-out, since a dashboard showing last week's sprint status undermines the whole point of connecting the two tools.
Frequently asked questions
Do I need Jira admin access to connect it to Power BI?
You need enough access to install an app from the Atlassian Marketplace, which usually means Jira admin rights, plus read access to the projects and boards you want to report on.
Is there one official Microsoft connector for Jira?
No — the Marketplace lists several third-party connector apps from different vendors, each with its own features, pricing, and trial terms, so it's worth comparing a couple before installing.
Can Power BI show sprint burndown charts using Jira data?
Yes. Once issue status, sprint dates, and story points are flowing into Power BI, you can build burndown-style visuals with more customization than Jira's native charts offer.
How current is the Jira data shown in Power BI?
It reflects whatever was pulled at the last sync. Scheduled refresh (usually a paid connector feature) keeps the dashboard aligned with ongoing sprint activity without manual exports.
Can I combine data from multiple Jira projects in one dashboard?
Yes — this is one of the main reasons to make the jump to Power BI, since you can sync several boards or projects and build a single portfolio-level report that Jira's native dashboards don't handle as well.
Watch the full walkthrough
The same steps, demonstrated on screen from start to finish.


